

Tesla (TSLA) dropped over 3% on May 12, 2026, hitting an intraday low of $422.26 after opening near $441. The catalyst was a combination of Elon Musk’s China trip, reports of robotaxi software glitches, and battery production delays. But traders who were watching only the news were already late. SweepAlgo’s TSLA GEX dashboard showed the structural conditions for today’s decline before the market opened.
Here’s exactly what the data showed, what it meant, and what it told traders before 9:30am.
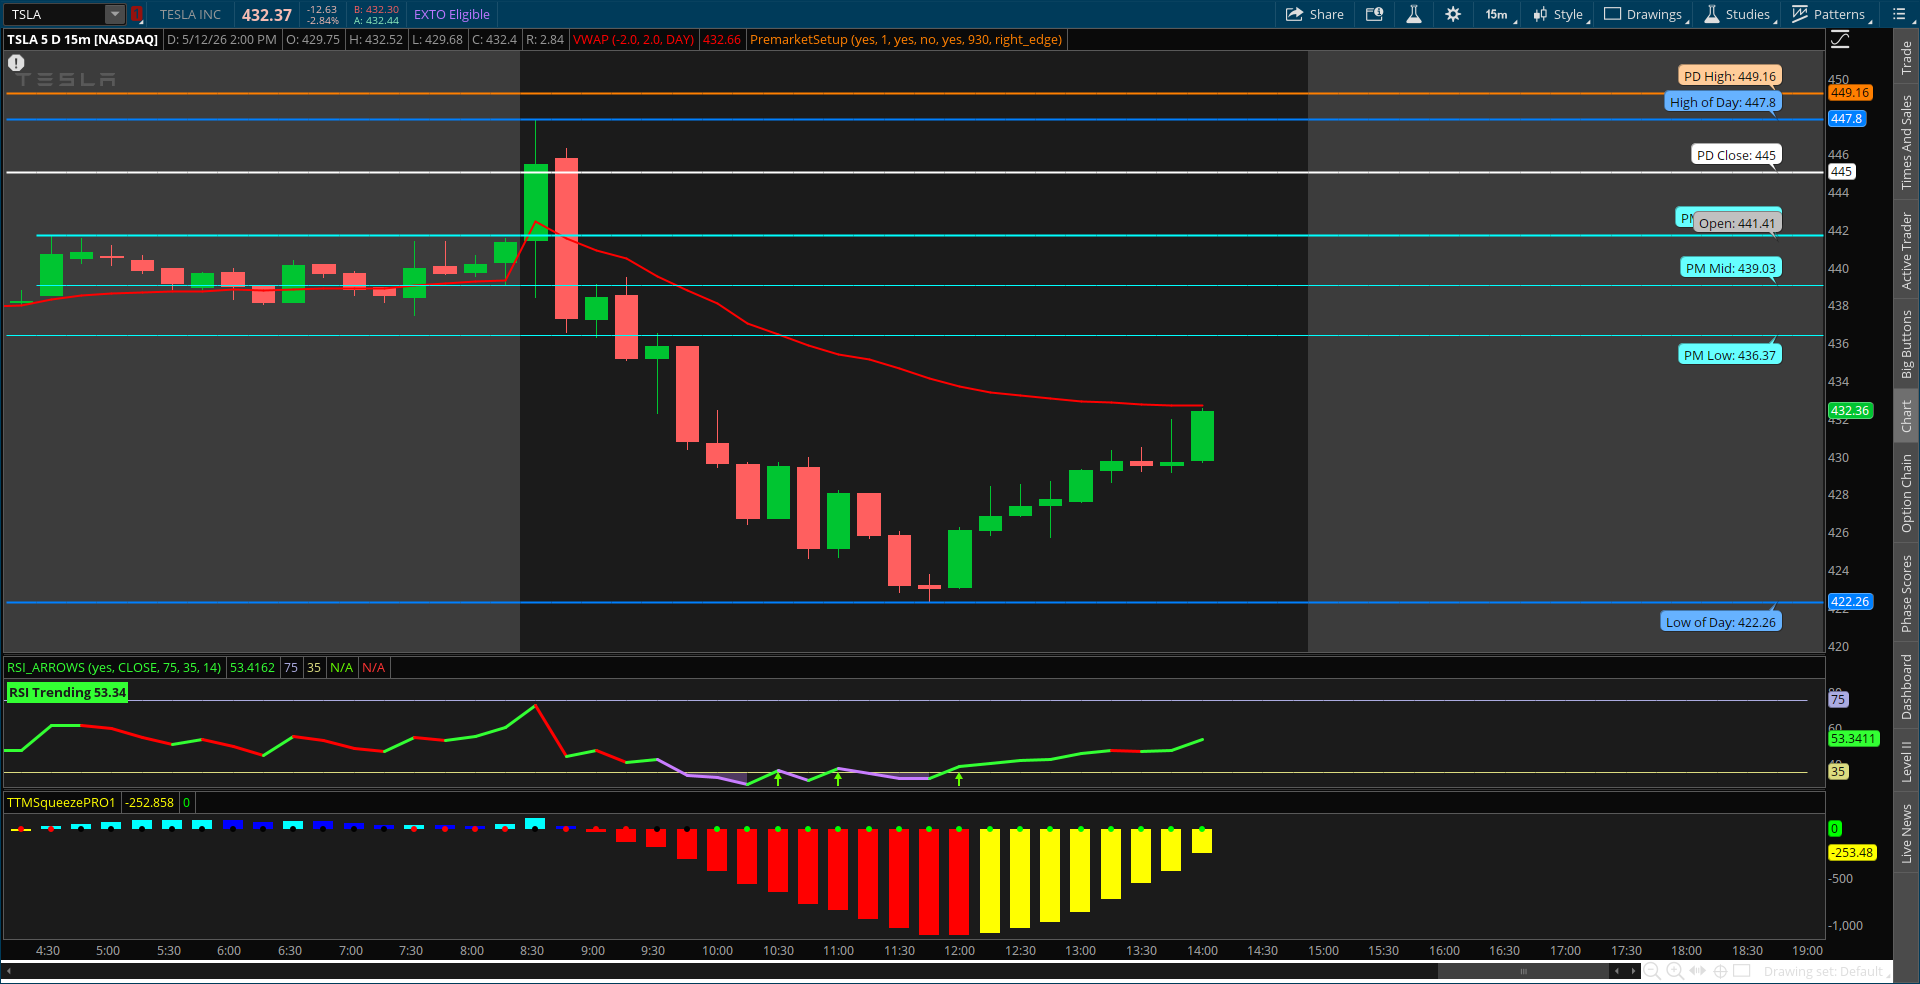
What Happened Today: The Price Action
TSLA’s 15-minute chart tells a clean story:
- Pre-market: TSLA opened the session near $441, above the prior close of $445
- 9:30am: Gapped down slightly, briefly touched $447.80 (high of day) in the first candle
- 9:30–11:30am: Relentless selling, dropping from $447 to $422.26 (low of day), a $25.54 decline in two hours
- 11:30am–2:00pm: Partial recovery, bouncing from $422 toward $432
- 2:00pm: Trading at $430.73, down $14.27 (-3.21%) on the day
The RSI hit oversold territory below 35 at the lows before recovering. The TTM Squeeze momentum indicator turned sharply negative at the open and remained red through the session.
Standard price action traders saw a breakdown and reacted. GEX traders knew the structural conditions for a breakdown existed before the open.
What SweepAlgo Showed Pre-Market
Here is the exact TSLA GEX structure visible in SweepAlgo before 9:30am on May 12, 2026:

Key Gamma Levels
| Level | Value | Meaning |
|---|---|---|
| Gamma Flip | $637.39 | TSLA is 32% below, deep negative gamma |
| Gamma Wall | $450.00 ($135.6M) | Primary structural resistance |
| Call Wall | $450.00 ($173.4M) | Secondary resistance, overlaps with gamma wall |
| Put Wall | $350.00 (-$20.8M) | Structural floor, break below $430 targets this |
| Support | $420.00 ($50.8M) | Nearest structural cushion below spot |
| Resistance | $450.00 ($135.6M) | Overhead cap on any rally |
| Max Pain | $390.00 | Expiration gravity target |
AI Analysis: Score 7.5, “Resistance Overhead”
“Market makers are LONG GAMMA at $435.00 (+$59.0M). When price approaches $435.00, dealers SELL into rallies. Expect choppy price action and rejection near $435.00.”
Net GEX: +$1.02B
The Pro Tip That Called It
SweepAlgo’s Pro Tip panel flagged this before the open:
“Put wall at $430 is 26x closer than call wall. Extreme asymmetric downside risk. Any weakness breaks $430 → acceleration to $350.”
That single line contained the entire structural thesis for today’s trade.
Breaking Down the Pre-Market Signal
Let’s translate what each data point meant in practical terms:
1. Gamma Flip at $637, TSLA in Deep Negative Gamma
TSLA at $441 pre-market was $196 below its gamma flip. In negative gamma, dealer re-hedging amplifies moves. When TSLA falls, dealers must sell to hedge newly negative delta, which pushes it lower. This is not sentiment, it’s mechanics.
The negative gamma regime meant: any catalyst today would produce a larger-than-normal move.
2. Resistance at $435 and $450, Rallies Were Pre-Capped
The AI Analysis identified $435 as the immediate resistance with $59M of gamma. The gamma wall and call wall both converged at $450 with nearly $309M of combined gamma. TSLA opened at $441, already inside the resistance zone. Any push to $447 (which happened in the first candle) was immediately sold by dealers.
This meant: the opening spike to $447 was a fade opportunity, not a breakout.
3. Support at $420, Put Wall at $350, The Downside Map
The support at $420 ($50.8M) was the first structural cushion below spot. The put wall at $350 was the next major level. With $430 acting as the nearest floor (the “put wall is 26x closer than call wall” warning), any break of $430 would remove the nearest support entirely.
This meant: the risk/reward was asymmetrically bearish. A 2% break lower had mechanical acceleration toward $350. A 4% rally faced $309M of resistance at $450.
4. Max Pain at $390, Expiration Pull
With max pain at $390, the mechanical expiration gravity was pulling TSLA $40–$50 below the current price. On expiration weeks, this pull is strongest in the final 2 days.
This meant: the structural target for any sustained weakness was the $390–$420 zone.
The Trade the GEX Structure Supported

Given the pre-market data, here are the structurally aligned positions that the GEX setup supported:
Bearish trade (most aligned with the structure):
- Bear call spread: short the $450 call wall, long $455 call
- Rationale: $309M of gamma resistance makes $450 an extremely reliable ceiling in negative gamma
- Risk: TSLA gaps above $450 on unexpected positive news
Directional put (for momentum traders):
- Buy TSLA puts at the $440 or $435 strike
- Entry: on rejection at the $441–$447 opening range (which happened in the first candle)
- Target: $420 support (first structural level) → $390 max pain
- Stop: TSLA reclaims and holds above $447
What to avoid:
- Buying TSLA calls expecting a sustained rally, $435 resistance was identified with $59M of gamma selling pressure
- Iron condors, negative gamma environment means amplified moves, not range-bound behavior
What Happened vs. What GEX Predicted
| GEX Signal | Prediction | What Happened |
|---|---|---|
| Resistance at $435–$450 | Rallies to $447 get sold | Opening spike to $447.80 reversed immediately |
| Negative gamma regime | Any drop gets amplified | $25 decline from high to low in 2 hours |
| Support at $420 | First floor below spot | Low of day was $422.26, tested $420 support |
| Asymmetric downside below $430 | $430 break → acceleration | $430 broke intraday, moved to $422 |
| Max pain at $390 | Expiration gravity target | Intraday low $422, still moving toward $390 zone |

The GEX structure didn’t predict the news. It predicted the structural conditions that would determine how price would respond to news. When the Musk-China headline hit, the GEX structure ensured it would produce a sharp down move, not a choppy sideways reaction.
Why This Keeps Happening to TSLA
TSLA produces outsized moves relative to its news on a regular basis. The structural reason is consistent: TSLA is almost always in negative gamma territory.
With the gamma flip at $637, TSLA would need to rally approximately 48% from current levels to enter positive gamma territory where dealer re-hedging dampens moves. Until that happens, TSLA is structurally wired for amplification, every directional move gets a mechanical tailwind from dealer hedging.
This isn’t a 2026 phenomenon. TSLA’s gamma dynamics have produced this amplification effect for years. The retail options community piles into TSLA calls and puts at such high volume that dealer gamma exposure is consistently massive and consistently negative at prices below $500–$600.
Understanding this doesn’t mean you always trade TSLA bearishly. It means you understand that moves will be amplified in both directions, that resistance levels are mechanical and reliable, and that the gamma flip tells you the regime before any trade is placed.
Related: TSLA GEX Explained: Why Tesla Moves the Way It Does
Related: What Is Gamma Exposure (GEX)?
How to Use SweepAlgo for TSLA Every Morning
The pre-market TSLA routine takes 3 minutes:
- Open SweepAlgo → type TSLA → check Key Gamma Levels panel
Note the gamma flip (regime), gamma wall (resistance ceiling), support level, put wall (floor), max pain (expiration target) - Read the AI Analysis score and label
Is it “Resistance Overhead”? “Bullish Structure”? “Premium Selling Conditions”? This tells you the structural bias instantly. - Read the Pro Tip
SweepAlgo’s Pro Tip identifies the most important asymmetric risk in the current setup, today’s “put wall 26x closer than call wall” warning was the key insight. - Set your levels
Write down resistance, support, and the nearest put wall. These are your structural stops and targets for any TSLA options trade today.
3 minutes. You now have the structural map that most TSLA options traders never see.

ALT: SweepAlgo TSLA GEX dashboard May 12, 2026 showing AI Analysis score 7.5 “Resistance Overhead,” Pro Tip: “Put wall at $430 is 26x closer than call wall. Extreme asymmetric downside risk. Any weakness breaks $430 → acceleration to $350.” Key Gamma Levels: Gamma Flip $637.39, Gamma Wall $450, Put Wall $350, Support $420, Max Pain $390
Check TSLA’s live GEX structure before every session →