

The first time most traders open a GEX heatmap, they stare at a wall of green and red numbers and have no idea what they’re looking at. Within a few minutes they close it and go back to their chart.
That’s a mistake. The GEX heatmap is one of the most information-dense tools available to retail traders, it shows you, at a glance, where the entire dealer hedging structure sits across every strike and expiration. Once you know how to read it, five seconds on the heatmap tells you more than 20 minutes of chart analysis.
Here’s exactly how to read it.
What a GEX Heatmap Is (and Isn’t)
A GEX heatmap is a visual representation of net gamma exposure at each strike price across multiple expiration dates. It shows you where options dealers are long gamma (green) and where they’re short gamma (red) across the entire options chain.
It is not a price prediction tool. It doesn’t tell you where price will go. It tells you where the structural forces, dealer hedging flows, are concentrated, and how they’ll behave when price arrives at those levels.
The Basic Color Key
Before reading anything else, understand the two colors:
Green (positive GEX at a strike):
Dealers are net long gamma at this strike. Their hedging is stabilizing, they’ll sell as price approaches from below and buy as price approaches from above. Green zones create friction and often act as resistance or cause consolidation.
Red (negative GEX at a strike):
Dealers are net short gamma at this strike. Their hedging is destabilizing, they’ll amplify moves rather than dampen them. Red zones are where price tends to accelerate, not stall.
The intensity of the color matters:
A bright, deep green bar at a strike = very heavy positive gamma = strong friction. A pale green bar = light positive gamma = mild friction. Same logic applies to red.
The Five Things to Identify First
When you open a GEX heatmap, do this scan in order:
1. Find the Brightest Green Bar (Gamma Wall)
This is the strike with the highest positive GEX, your gamma wall. It’s the strongest magnet in the heatmap. Price gravitates toward it and stalls near it. Mark this level on your chart.
Related: What Is a Gamma Wall? How Options Dealers Create Price Ceilings
2. Find Where Green Turns to Red (Gamma Flip)

Scan from the top of the heatmap downward. The row where you see the transition from net green to net red across the nearest expiration, that’s approximately your gamma flip level. This is the regime boundary.
Related: Gamma Flip Levels Explained: How to Trade the Most Powerful Level in the Market
3. Find the Deepest Red Zone (Negative Gamma Concentration)
Where is the most concentrated red? This is where price will accelerate most aggressively if it trades through. On a breakdown day, the deepest red zone below the gamma flip is often where you see the biggest candles.
4. Check Where Spot Price Sits
Most heatmaps mark the current spot price on the chart. Is it in a green zone (positive gamma, stabilizing) or red zone (negative gamma, amplifying)? Is it near the gamma wall (friction) or far from any major level (room to run)?
5. Look Across Expirations
The heatmap shows gamma by expiration date, today’s expiry, this week’s, next week’s, etc. The nearest expiration has the most gamma influence on today’s price. Longer-dated expirations show you where structural positioning is building for the coming weeks.
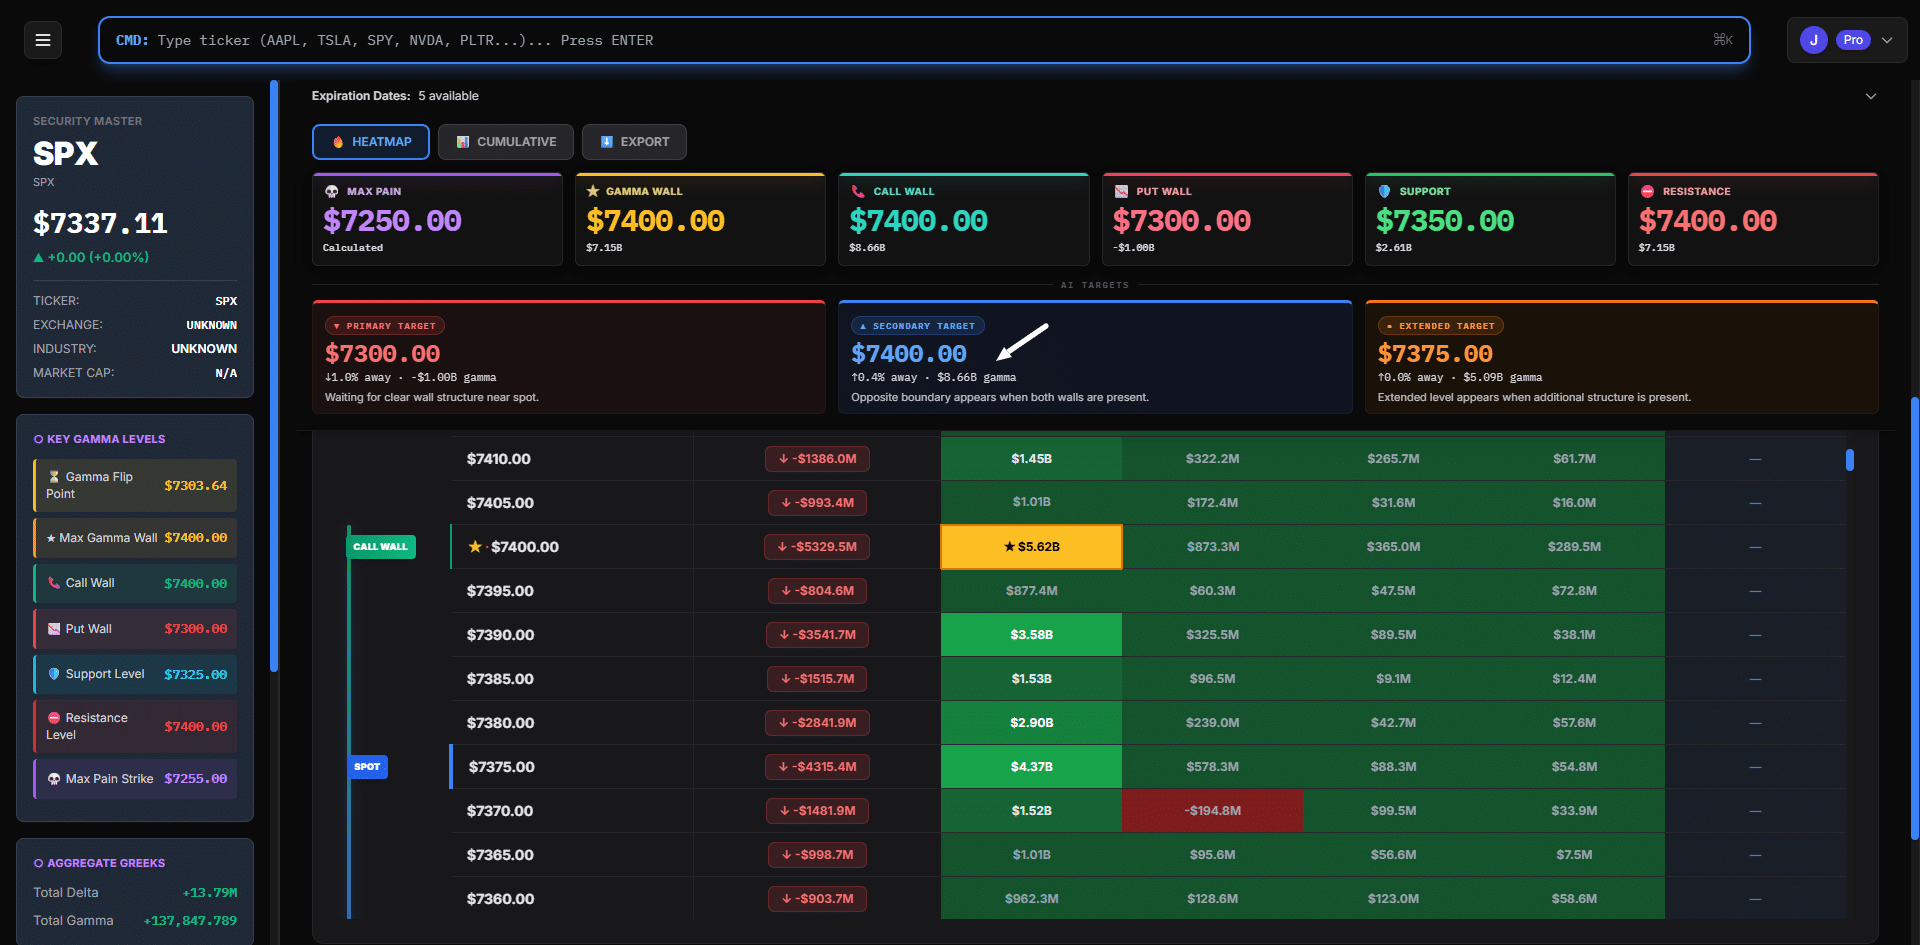
Reading the SweepAlgo NetGEX Heatmap
SweepAlgo’s heatmap layout is organized with:
- Rows = strike prices (highest at top, lowest at bottom)
- Columns = expiration dates (nearest on the left)
- Colors = green (positive GEX) and red (negative GEX) with intensity showing magnitude
- “SPOT” marker = current price, so you can instantly see where price sits in the structure
- “CALL WALL” marker = the strike with the highest call-side gamma, usually matching the gamma wall
- Dollar figures = the actual net GEX dollar value at each strike/expiry cell

ALT: SweepAlgo NetGEX heatmap for AMZN showing call wall labeled at $275, spot price marker at $270.88, and color-coded gamma exposure from green positive to red negative across multiple expirations
A Worked Example: Reading the Heatmap on a Live Day
Let’s say SPY opens at $558 and you pull up the GEX heatmap. Here’s what you might see and what it means:
What the heatmap shows:
- Brightest green bar: $560 strike (this week’s expiry) = Gamma Wall
- Green-to-red transition: $552 strike = Gamma Flip
- Deepest red: $545–$548 range = Negative gamma zone, acceleration risk
- Spot: $558 (between gamma flip and gamma wall)
What it tells you:
- You’re in a positive gamma environment, dealers dampen volatility
- Price has $2 of room to grind up toward the gamma wall at $560
- If it gets through $560, watch for a momentum-driven move (dealer selling exhausted)
- If price drops to $552, the regime flips, expect volatility to expand
- If price breaks below $548, the negative gamma zone takes over, moves will accelerate
Five seconds on the heatmap. That’s your entire structural map for the day.
Common Mistakes When Reading a GEX Heatmap
Ignoring expiration columns. The heatmap shows different gamma by expiry. Heavy gamma in next month’s expiry doesn’t influence today’s price as much as this week’s. Always read the nearest expiry column first.
Treating all green as support. A light green bar at a strike doesn’t mean strong support. Only heavy green concentrations (bright, high dollar values) create meaningful friction. Learn to read the intensity, not just the color.
Confusing the gamma wall with a hard ceiling. The gamma wall is where friction is highest, not a wall price can never break. High-volume, high-conviction moves (like a Fed reaction) can blow through gamma walls. The wall raises the bar for a breakout, it doesn’t prevent one.
Not updating the heatmap intraday. GEX shifts as price moves and options are traded. The heatmap you pulled at 9:30am may look different by 1pm. SweepAlgo updates in real time, check it, don’t just look once and walk away.
How the Heatmap Works Across Different Tickers
The GEX heatmap is most powerful on:
- SPY / SPX, highest options volume, most reliable GEX signal
- QQQ, strong options flow, good gamma structure
- High-OI single stocks, AAPL, NVDA, TSLA, AMZN, META work well
It’s least reliable on:
- Low-OI stocks, not enough dealer participation for meaningful gamma walls
- Stocks near earnings, gamma structure distorts dramatically in the week before earnings
The Bottom Line
Reading a GEX heatmap isn’t complicated once you know the five things to look for: the gamma wall, the gamma flip, the negative gamma zone, where spot sits, and which expiration is driving today’s structure. That five-second scan gives you a structural map that most retail traders never have.