

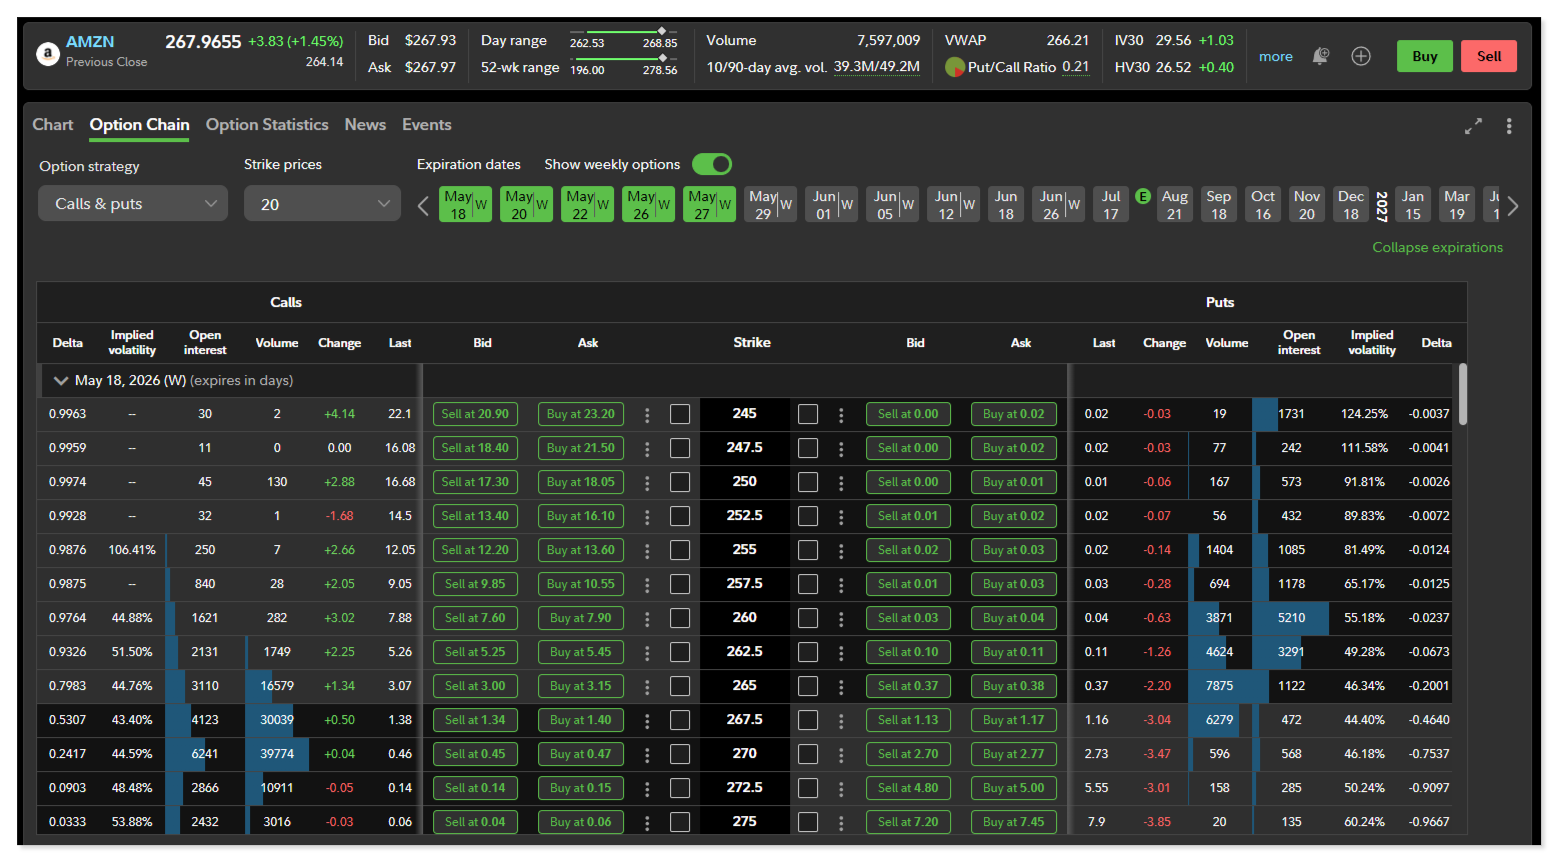
The options chain is the interface between your thesis and your trade. Every broker shows one. Most beginners stare at it and feel overwhelmed by the grid of numbers. Within five minutes of reading this, you’ll be able to read any options chain on any broker and know exactly what you’re looking at.
Table of Contents
- What Is an Options Chain?
- How an Options Chain Is Structured
- The Columns Explained, One by One
- How to Read Expiration Dates
- Calls Side vs. Puts Side
- Reading Strike Prices: ITM, ATM, OTM
- How to Spot a Liquid vs. Illiquid Option
- What Open Interest Tells You
- Using GEX to Choose the Right Strike
- FAQ
What Is an Options Chain?
An options chain (also called an options table or options board) is a real-time list of every available options contract for a given stock or ETF, organized by expiration date and strike price.
It shows you exactly what you can buy, what it costs, how liquid it is, and how it’s positioned relative to the current stock price. Every option you’ll ever trade lives somewhere on that chain.
How an Options Chain Is Structured

Every options chain is built around two axes:
- Vertical axis: Strike prices, listed from lowest to highest
- Horizontal axis: Contract details – bid, ask, volume, open interest, delta, implied volatility, and more
The chain is split down the middle: calls on the left, puts on the right. The current stock price sits somewhere in the middle of the strike list, dividing in-the-money contracts (shaded) from out-of-the-money ones (unshaded).
At the top, you choose your expiration date. Each expiration date has its own full chain of strikes.
The Columns Explained, One by One
Here’s what each column actually means:
| Column | What It Shows | What to Look For |
|---|---|---|
| Strike | The price at which you can buy (call) or sell (put) the stock | Pick based on your target and GEX levels |
| Last | The most recent trade price | Less useful – can be stale |
| Bid | Highest price a buyer will pay right now | This is what you get if you sell |
| Ask | Lowest price a seller will accept right now | This is what you pay if you buy |
| Mid | Midpoint between bid and ask | A fair estimate of the true value |
| Volume | Contracts traded today | Look for volume > 100 minimum |
| Open Interest (OI) | Total open contracts at this strike | Higher = more liquid, more structural significance |
| IV | Implied volatility for this specific contract | Compares cost vs. historical norms |
| Delta | Price sensitivity to stock movement | Tells you how much the option moves per $1 |
| Gamma | Rate of delta change | Higher near ATM and near expiration |
| Theta | Daily time decay | How much value bleeds per day |
Most brokers let you customize which columns appear. At minimum, always have: bid, ask, volume, open interest, and delta visible before entering a trade.
How to Read Expiration Dates
At the top of the chain, you’ll see a dropdown or tab selector for expiration dates. SPY, for example, expires every Monday, Wednesday, and Friday. Most single stocks expire on Fridays only, with monthly options expiring on the third Friday of each month.
The further out the expiration, the more expensive the option – you’re paying for more time. The tradeoff:
- Short-dated (0–14 days): Cheap, high leverage, theta accelerates fast, less forgiving
- Medium-dated (21–45 days): The beginner sweet spot – gives your thesis time to play out without excessive premium
- Long-dated (60–180+ days): More expensive, slower moving, useful for longer-term directional views or hedges
Rule of thumb: As a beginner, start with 30–45 days to expiration (DTE). It gives you time without overexposing you to theta in the final stretch.
Calls Side vs. Puts Side
The chain is divided into two halves at every strike:
Left side = Calls. These gain value when the stock rises. In-the-money calls (stock price above strike) are typically shaded on most platforms.
Right side = Puts. These gain value when the stock falls. In-the-money puts (stock price below strike) are typically shaded.
The strike price column runs down the center, shared by both sides. When you’re looking at a $540 strike, the call at $540 and the put at $540 are different contracts with different prices – but they’re linked to the same underlying price level.
Related: What Is a Call Option? → | What Is a Put Option? →
Reading Strike Prices: ITM, ATM, OTM
With SPY trading at $541:
| Zone | Calls | Puts |
|---|---|---|
| In-the-Money (ITM) | Strikes below $541 (e.g., $530, $535) | Strikes above $541 (e.g., $545, $550) |
| At-the-Money (ATM) | Strike closest to $541 | Strike closest to $541 |
| Out-of-the-Money (OTM) | Strikes above $541 (e.g., $545, $550) | Strikes below $541 (e.g., $535, $530) |
ITM options cost more and have higher deltas. OTM options are cheaper but need a large move to profit. ATM options are the most sensitive to price movement and the most commonly traded by directional traders.
Most brokers shade ITM strikes to help you identify them visually. When in doubt: if you’re bullish and SPY is at $541, any call strike above $541 is OTM.
How to Spot a Liquid vs. Illiquid Option
Liquidity is the single most underrated factor in strike selection. Trading an illiquid option is one of the fastest ways to lose money even on a correct directional trade.
Signs of a liquid option:
- Bid-ask spread under $0.15 (ideally $0.05–$0.10)
- Volume over 500 contracts today
- Open interest over 1,000 contracts
Signs of an illiquid option:
- Bid-ask spread over $0.50
- Volume under 50
- Open interest under 200
If the bid is $0.50 and the ask is $1.50, you’re paying $1.00 just to enter – a 67% markup over mid. You need a significant move just to break even on the spread alone. Avoid these contracts until you’re experienced enough to know when the edge justifies the cost.
Best underlyings for liquid options: SPY, SPX, QQQ, AAPL, NVDA, TSLA, AMZN, MSFT. These have tight spreads across most strikes and expirations.
What Open Interest Tells You
Open interest (OI) is the total number of outstanding (open) contracts at a given strike. Unlike volume – which resets daily – OI builds over time and reflects cumulative positioning.
High OI at a strike means:
- Many traders and institutions are positioned there
- The contract is more liquid (tighter spreads)
- That strike is structurally significant – market makers have meaningful exposure there
This last point is critical. When you see unusually high OI concentrated at a specific strike – say, 80,000 contracts at the SPY $545 call – that’s not random. Institutions built that position deliberately, and market makers who sold those contracts are delta-hedging against it. That creates mechanical price behavior near that strike.
This is exactly what GEX data measures at scale: the aggregate gamma exposure from all that open interest, translated into levels where dealer hedging will push or resist price.
Open interest alone doesn’t tell you whether the OI is from buyers or sellers. GEX data tells you what the net positioning means for price behavior.
Using GEX to Choose the Right Strike

Reading the options chain tells you what’s available. GEX data tells you what’s structurally significant.
Before settling on a strike, check SweepAlgo for three things:
1. Call walls and put walls
These are the strikes with the highest concentrated options exposure. A call wall between your current price and your target strike is structural resistance – market maker selling pressure that can cap the move. A put wall below your target is either support (positive gamma) or an accelerant (negative gamma).
2. The gamma flip
Is the market in positive or negative gamma? Positive gamma favors range-bound strategies and selling premium. Negative gamma favors directional momentum plays. Knowing the regime before choosing your strike changes everything.
3. Max pain
Max pain is the strike where the most options expire worthless. As expiration approaches, price tends to drift toward max pain. If your strike is far from max pain with only a week left, you’re fighting a gravitational force.
Example:
SPY is at $541. You want to buy a call. You’re debating the $543 vs. the $546 strike.
You check SweepAlgo and see a call wall at $544 with $210M of open interest. The $543 strike sits just below that wall – your call benefits from any move toward the wall. The $546 strike is above the wall – price needs to break through heavy dealer selling to get there. Same direction, same expiration, completely different structural context.
That’s the difference between reading the chain and understanding the chain.
FAQ
What is an options chain?
An options chain is a real-time list of all available options contracts for a stock, organized by expiration date and strike price, showing pricing, volume, open interest, and Greeks for each contract.
How do I read bid and ask on an options chain?
The bid is what buyers will pay. The ask is what sellers want. You’ll pay the ask when buying and receive the bid when selling. The mid (midpoint) is the fair value estimate. Tight bid-ask spreads indicate liquid, tradeable options.
What does open interest mean on an options chain?
Open interest is the total number of outstanding contracts at that strike. High OI means more participants are positioned there, making the contract more liquid and the strike level more structurally significant for price behavior.
What is the most important column to look at?
For beginners: bid-ask spread (liquidity check), open interest (structural significance), delta (how much it moves), and volume (today’s activity). These four tell you whether the contract is worth trading and how it will behave.
How do I find ATM options on a chain?
Look for the strike price closest to the current stock price. Most brokers highlight or shade ITM contracts. The ATM strike will have the highest delta near 0.50 (for calls) or −0.50 (for puts) and typically the tightest bid-ask spread.
Why does the same strike have different prices for calls and puts?
Because they convey different rights. A call gives you the right to buy; a put gives you the right to sell. Their values are mathematically linked (through put-call parity), but they’re priced independently based on their own demand, IV, and time value.
The Bottom Line
The options chain stops being intimidating the moment you know what each column is telling you. Bid-ask spread tells you if it’s worth trading. Open interest tells you where positioning is concentrated. Delta tells you how the contract moves. The expiration tells you how much time you have.
What the chain doesn’t tell you – where mechanical resistance and support actually sit, what gamma regime you’re trading in, where price has gravitational pull toward expiration – that’s what GEX data fills in.
See live GEX levels alongside your options chain on SweepAlgo →
Disclaimer: This content is for educational purposes only and does not constitute financial advice. Options trading involves substantial risk of loss and is not appropriate for all investors.