

Tesla (TSLA) is the most gamma-intensive single stock in the U.S. options market. On any given day, TSLA options trade over $200 billion in notional value, often surpassing the rest of the S&P 500 single-stock options market combined. That volume creates a gamma exposure (GEX) structure that mechanically drives TSLA’s intraday price behavior in ways that pure price action analysis completely misses.
This guide explains how GEX works specifically for TSLA, what the key levels mean, and how to read the structural map before trading TSLA options.
Table of Contents
- Why TSLA Has Extreme Gamma Dynamics
- TSLA’s Key GEX Levels Explained
- How the Gamma Flip Defines TSLA’s Regime
- The Gamma Wall: TSLA’s Structural Ceiling
- The Put Wall: TSLA’s Structural Floor
- Max Pain and Where TSLA Closes on Expiration
- Reading TSLA’s AI Analysis Score
- TSLA GEX in Action: May 12, 2026
- How to Trade TSLA Options Using GEX
- FAQ
Why TSLA Has Extreme Gamma Dynamics
TSLA’s gamma dynamics are more extreme than almost any other equity for three reasons:
1. Massive retail options volume
TSLA is the most actively traded single-stock options ticker. Retail traders buy TSLA calls and puts at extraordinary volume, creating large open interest positions at specific strikes that generate significant dealer gamma exposure.
2. High stock price volatility
TSLA has a historical 30-day volatility of 50–80% in most market conditions. High volatility = higher options premiums = larger gamma exposure per contract. A dealer hedging TSLA gamma faces much larger hedge adjustments per dollar of price move than a dealer hedging, say, AAPL.
3. Cult-like options activity around catalysts
Every Elon Musk tweet, robotaxi announcement, earnings report, and macro headline triggers a wave of TSLA options buying. These concentrated positions build gamma exposure at specific strikes that then act as structural levels for the stock.
The result: TSLA’s price often moves not because of fundamental news, but because of the mechanical hedging behavior of market makers managing their gamma exposure.
External: Tesla Options, Over $200B Daily Notional
TSLA’s Key GEX Levels Explained

SweepAlgo calculates six key GEX levels for TSLA. Here’s what each one means and how it affects price behavior:
Gamma Flip Point
The price level where TSLA’s Net GEX crosses zero. Above it, dealers are long gamma, they stabilize price. Below it, dealers are short gamma, they amplify moves.
Current level (May 12, 2026): $637.39
TSLA is trading at $430, which is $207 below the gamma flip. This means TSLA is deep in negative gamma territory, every down move is amplified by dealer re-hedging.
Max Gamma Wall
The strike with the highest positive gamma concentration. This acts as TSLA’s structural ceiling, dealers sell aggressively as price approaches this level.
Current level: $450.00 ($135.6M gamma)
Call Wall
The strike with the highest call open interest. Secondary resistance above the gamma wall.
Current level: $450.00 ($173.4M)
Put Wall
The strike with the highest put open interest. Acts as structural support, but in negative gamma, a break below the put wall accelerates the move lower.
Current level: $350.00 (-$20.8M)
Support Level
A secondary structural level with positive gamma providing a cushion.
Current level: $420.00 ($50.8M)
Max Pain Strike
The expiration price where maximum options expire worthless, the gravitational target as expiration approaches.
Current level: $390.00
How the Gamma Flip Defines TSLA’s Regime
The gamma flip is the single most important number for understanding TSLA’s structural behavior on any given day.
When TSLA is above the gamma flip:
Dealers are long gamma. They buy dips and sell rallies automatically. TSLA tends to be range-bound, with mechanical resistance at rallies and support at dips. This is the environment where TSLA “grinds” sideways and option sellers win.
When TSLA is below the gamma flip:
Dealers are short gamma. They sell into down moves and buy into up moves, amplifying the trend. This is the environment where TSLA produces sharp, fast directional moves. Every leg down is met with dealer selling that pushes it further.
The current situation:
With TSLA at $430 and the gamma flip at $637, TSLA is approximately 32% below its gamma flip. This is deep negative gamma territory. In this regime, TSLA’s intraday moves are amplified in both directions. A 3% down day can cascade quickly because dealer hedging is pro-cyclical, adding to the move rather than dampening it.
This structural reality explains why TSLA regularly produces 5–10% single-day moves that seem disproportionate to the news. The news is the catalyst. The gamma is the amplifier.
The Gamma Wall: TSLA’s Structural Ceiling
The gamma wall at $450 represents $135.6M of positive gamma concentration. When TSLA price approaches $450, dealers with short call positions must sell TSLA shares (or buy puts) to hedge, creating mechanical selling pressure that resists the move.
What this means practically:
- $450 is the first major structural resistance for any TSLA rally
- Breakouts above $450 face heavy dealer selling that needs to be absorbed
- Until $450 breaks cleanly and holds, any TSLA rally is structurally capped
The call wall at $450 overlaps with the gamma wall (both $450), this double concentration makes $450 an especially significant level. $173.4M of call wall gamma plus $135.6M of gamma wall creates nearly $309M of combined dealer hedging pressure at that single strike.
The Put Wall: TSLA’s Structural Floor
The put wall at $350 represents the strike with the most concentrated put open interest. In negative gamma conditions, the put wall functions differently than in positive gamma:
In positive gamma: The put wall acts as a floor, dealers buy shares near this level to hedge, supporting price.
In negative gamma (TSLA’s current regime): A break below the put wall removes that support and triggers dealer short-selling as they hedge newly in-the-money puts. This creates accelerated downside.
SweepAlgo’s Pro Tip for today captures this precisely:
“Put wall at $430 is 26x closer than call wall. Extreme asymmetric downside risk. Any weakness breaks $430 → acceleration to $350.”
The $430 level (current support) sits just $0.73 below spot. If $430 breaks and holds, the next structural reference is the put wall at $350, a potential additional 18.6% decline driven by mechanical dealer hedging, not just sentiment.
Max Pain and Where TSLA Closes on Expiration
Max pain at $390 represents the strike where the total value of all open TSLA options is minimized, the price at which maximum options contracts expire worthless.
On expiration weeks (especially monthly/quarterly), TSLA has a documented tendency to drift toward max pain in the final 2–3 days of the expiration cycle. This isn’t manipulation, it’s the natural result of dealers managing their expiring books by reducing their hedge positions, which mechanically moves price toward the strike with the least open interest pressure.
Current implication:
With TSLA at $430 and max pain at $390, there’s a $40 structural pull toward lower prices specifically from expiration mechanics, independent of any fundamental or news-driven factors.
Reading TSLA’s AI Analysis Score
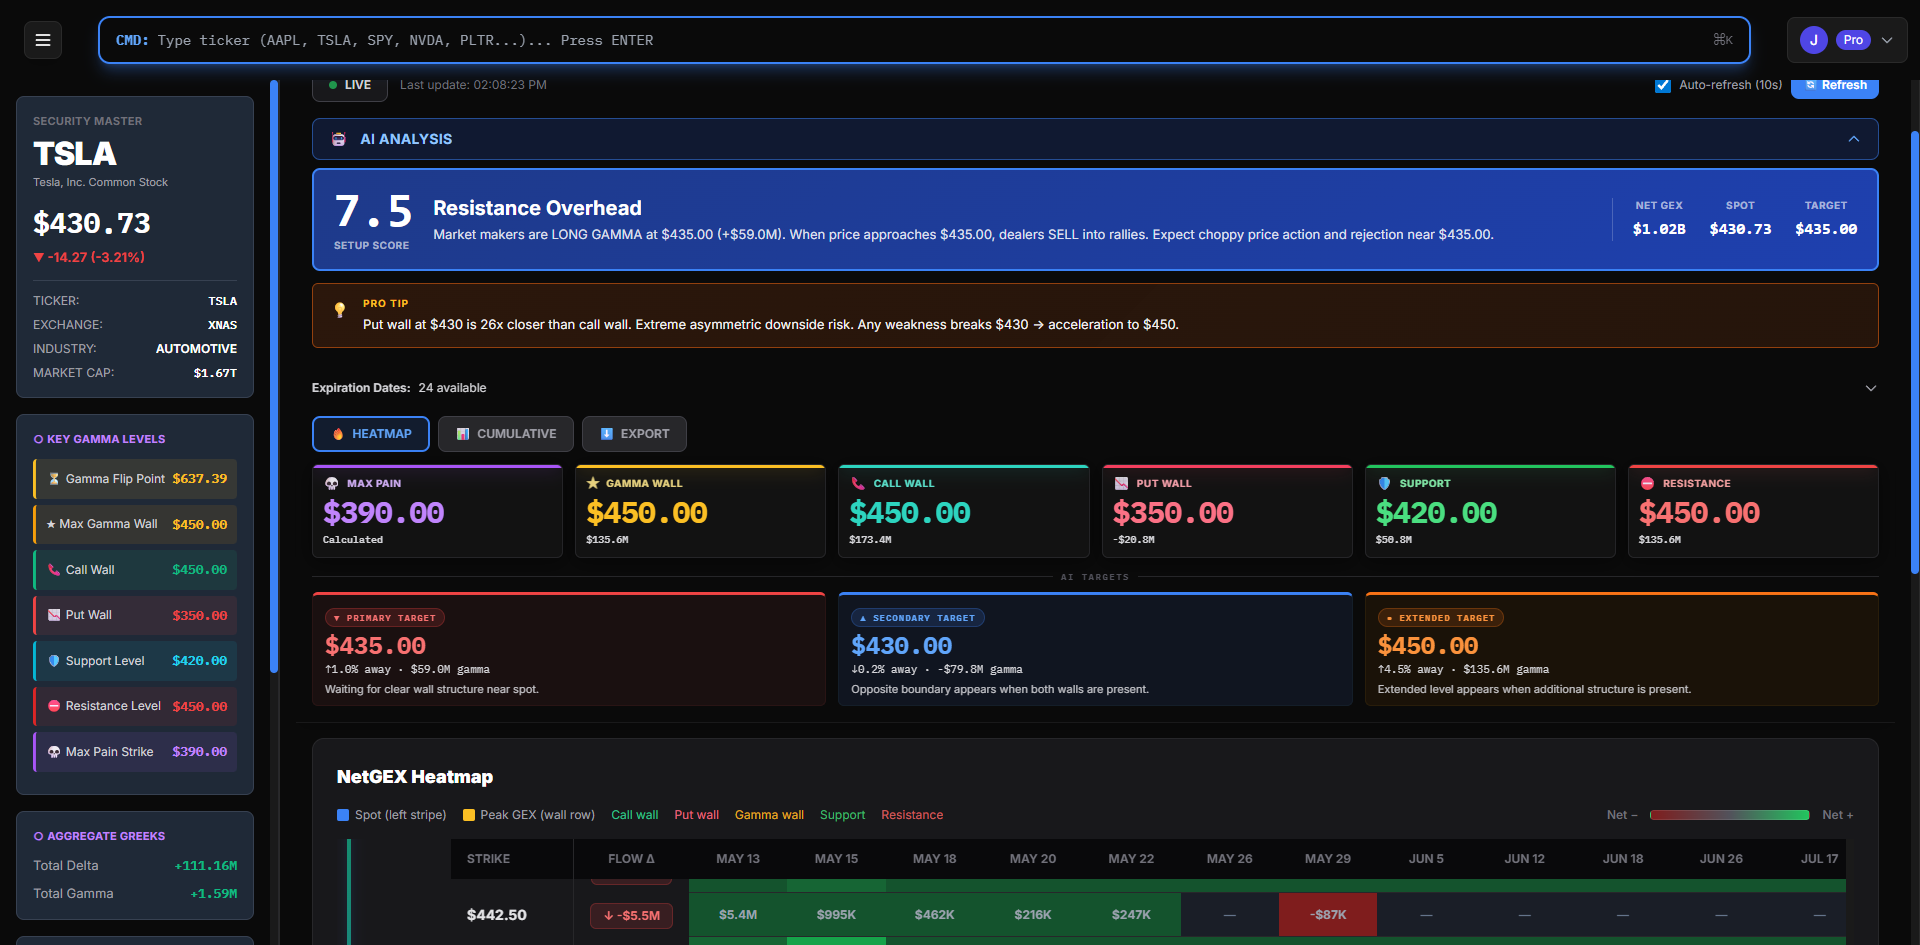
SweepAlgo’s AI Analysis panel synthesizes the GEX structure into a plain-English regime read and setup score. For TSLA on May 12, 2026:
Score: 7.5, “Resistance Overhead”
“Market makers are LONG GAMMA at $435.00 (+$59.0M). When price approaches $435.00, dealers SELL into rallies. Expect choppy price action and rejection near $435.00.”
The score of 7.5 indicates a high-confidence structural read. The “Resistance Overhead” label tells you the primary structural force at the current price level is downward, dealers are positioned to sell any rally to $435.
What this means for TSLA options traders:
- Buying TSLA calls expecting a sustained rally above $435 fights dealer mechanics
- The path of least resistance is toward the primary target ($435 rejection) or secondary target ($430 breakdown)
- Put spreads targeting $390–$420 are structurally aligned with the gamma setup
TSLA GEX In Action: May 12, 2026

Today’s TSLA session is a real-time illustration of negative gamma mechanics.
Pre-market structural read (from SweepAlgo):
- TSLA below gamma flip by 32%, deep negative gamma
- Support at $420, resistance at $450
- Pro Tip flagged extreme asymmetric downside risk below $430
- AI Analysis: 7.5, Resistance Overhead at $435
What happened:
TSLA opened near $441, spiked to $447.80 (high of day), then reversed sharply. By midday it had dropped to a low of $422.26, a $25.54 intraday decline from the high. The reversal happened exactly at the resistance level the GEX structure identified pre-market.
The Musk-China news and robotaxi headline were the catalysts. But the speed and magnitude of the move, over 5% from high to low in a single session, was amplified by negative gamma mechanics. Dealers selling into the decline accelerated every leg lower.
The GEX told you before the open:
- Resistance at $450/$435, fade rallies
- Asymmetric risk to $430 breakdown → $350
- Deep negative gamma = amplified moves, not range-bound
Traders who checked SweepAlgo’s TSLA dashboard pre-market had this structural map. Traders relying only on price action were reacting to moves that had already happened.

ALT: SweepAlgo TSLA GEX dashboard showing Key Gamma Levels panel: Gamma Flip $637.39, Gamma Wall $450 ($135.6M), Call Wall $450 ($173.4M), Put Wall $350 (-$20.8M), Support $420 ($50.8M), Max Pain $390, AI Analysis score 7.5 “Resistance Overhead” with Pro Tip warning of extreme asymmetric downside below $430
Check TSLA’s live GEX structure on SweepAlgo →
How to Trade TSLA Options Using GEX

Step 1: Check the regime
Is TSLA above or below the gamma flip? Above = dealers stabilize (range strategies). Below = dealers amplify (momentum/directional strategies, put spreads on weakness).
Step 2: Identify key levels
Note the gamma wall (resistance ceiling), support level, put wall (floor/acceleration point), and max pain (expiration target). These are your structural reference points, not arbitrary technicals.
Step 3: Read the AI Analysis
What’s the setup score? What’s the plain-English regime label? This tells you the structural bias before you pick a direction.
Step 4: Align your trade with the structure
- Negative gamma + below gamma flip + resistance overhead → favor put spreads, bear call spreads, or directional puts on momentum
- Positive gamma + above support → favor iron condors, credit spreads, or bounce plays at support
Step 5: Use GEX levels as stops and targets
- Stop: price reclaims the resistance level (gamma wall or AI Analysis target)
- Target: next structural level in the direction of the trade (support → put wall → max pain)
Frequently Asked Questions
Why does TSLA move so much more than other stocks?
Three reasons: extreme retail options volume, high implied volatility, and deep negative gamma (TSLA is typically below its gamma flip). When dealers are short gamma, every price move triggers re-hedging that amplifies the move. TSLA’s massive options market means this effect is larger than almost any other stock.
What is TSLA’s gamma flip level?
As of May 12, 2026, TSLA’s gamma flip is $637.39. This means TSLA would need to rally approximately 48% from current levels ($430) to enter positive gamma territory where moves are dampened. At current prices, TSLA is deep in negative gamma.
What does TSLA’s put wall at $350 mean?
The put wall is the strike with the highest put open interest. In TSLA’s current negative gamma regime, a break below the support at $420 and the nearby $430 level would remove structural support and trigger mechanical dealer selling toward the put wall at $350. This is a structural, not fundamental, target.
Can GEX predict TSLA’s price?
GEX doesn’t predict price, it identifies the structural forces that influence price. It tells you where mechanical resistance and support exist, whether the regime amplifies or dampens moves, and what levels are likely gravitational targets. Combined with a directional thesis, GEX dramatically improves entry and exit precision.
How often does TSLA’s GEX structure change?
TSLA’s GEX heatmap updates continuously as options are traded. The gamma flip, gamma wall, and put wall can shift over days and weeks as open interest changes. SweepAlgo’s live dashboard shows the current structure in real time.
What is the best options strategy for TSLA in negative gamma?
In negative gamma (TSLA’s current regime), the most structurally aligned strategies are: directional puts or put spreads on momentum breaks below support; bear call spreads above resistance (gamma wall); avoid selling premium in iron condors (negative gamma means the condor wings can be breached quickly).
The Bottom Line
TSLA’s price behavior isn’t random. It’s mechanically driven by the gamma exposure of market makers managing one of the largest single-stock options markets in the world. Understanding the gamma flip (regime), gamma wall (resistance), put wall (floor/acceleration), and max pain (expiration target) gives you a structural map before every TSLA session. Without it, you’re reacting to moves that the GEX structure already told you were coming.