

Gamma exposure analysis reveals Advanced Micro Devices (AMD) is trading in an extreme high-volatility bearish environment with -$76.5M net gamma exposure according to Sweepalgo.com.
Following yesterday’s decline, AMD now sits at $199.90, positioned 10.1% below the critical $220 resistance level where $10.8M in gamma exposure creates a massive wall that consistently rejects rallies.
This comprehensive analysis uses real-time gamma exposure data from Sweepalgo.com to explain why AMD’s heavily negative gamma amplifies semiconductor sector volatility, identify key price levels where market maker hedging creates mechanical pressure, and outline specific trading strategies for this treacherous environment. Understanding gamma exposure is crucial for AMD traders because this stock’s -$76.5M positioning creates explosive moves that can quickly overwhelm unprepared investors.
What Is Gamma Exposure?
Gamma exposure (GEX) measures the mechanical buying and selling pressure that options market makers must execute to maintain hedged positions as stock prices move.
For volatile semiconductor stocks like AMD, understanding gamma exposure often matters more than quarterly earnings or chip demand forecasts, because these invisible mechanical flows can move the stock 5-10% regardless of fundamentals.
When traders buy AMD call options, market makers who sell those options must immediately hedge by buying AMD shares to offset their directional risk.
As AMD’s price moves throughout the day, the delta of those options changes based on gamma, forcing market makers to continuously adjust their share holdings.
This constant rebalancing creates real buying and selling pressure that either stabilizes prices in positive gamma environments or amplifies momentum in negative gamma setups like AMD’s current situation.
Sweepalgo.com calculates aggregate gamma exposure across all 21 available AMD expiration dates, from zero-day-to-expiration (0DTE) options through long-term LEAPS contracts, revealing exactly where hedging pressure concentrates. This provides semiconductor traders with a structural edge beyond what chip sales forecasts or competitive positioning analysis can offer.
Positive vs Negative Gamma Exposure
The critical distinction between positive and negative gamma exposure determines whether market maker hedging acts as a stabilizer or an amplifier of price movements. When net GEX is positive, market makers are net short options, which forces them to buy shares when prices fall and sell shares when prices rise. This counter-trend behavior dampens volatility and creates the choppy, range-bound conditions where breakout attempts fail and mean reversion dominates.
When net GEX is negative, as it is with AMD’s -$76.5M reading, market makers are net long options, forcing them to sell shares into declining prices and buy shares into rallies. This pro-trend behavior amplifies momentum in both directions, explaining why AMD can gap down 3% on moderate news or rally 7% on minimal catalysts. The negative gamma creates a feedback loop where small moves trigger hedging activity that accelerates those moves further.
AMD’s -$76.5M gamma exposure ranks as extremely negative even among volatile semiconductor stocks, placing it in the highest-risk category for volatility expansion. This isn’t just academic theory—this mechanical reality explains yesterday’s sharp decline and suggests more explosive moves lie ahead until gamma positioning shifts.
AMD Gamma Exposure Profile
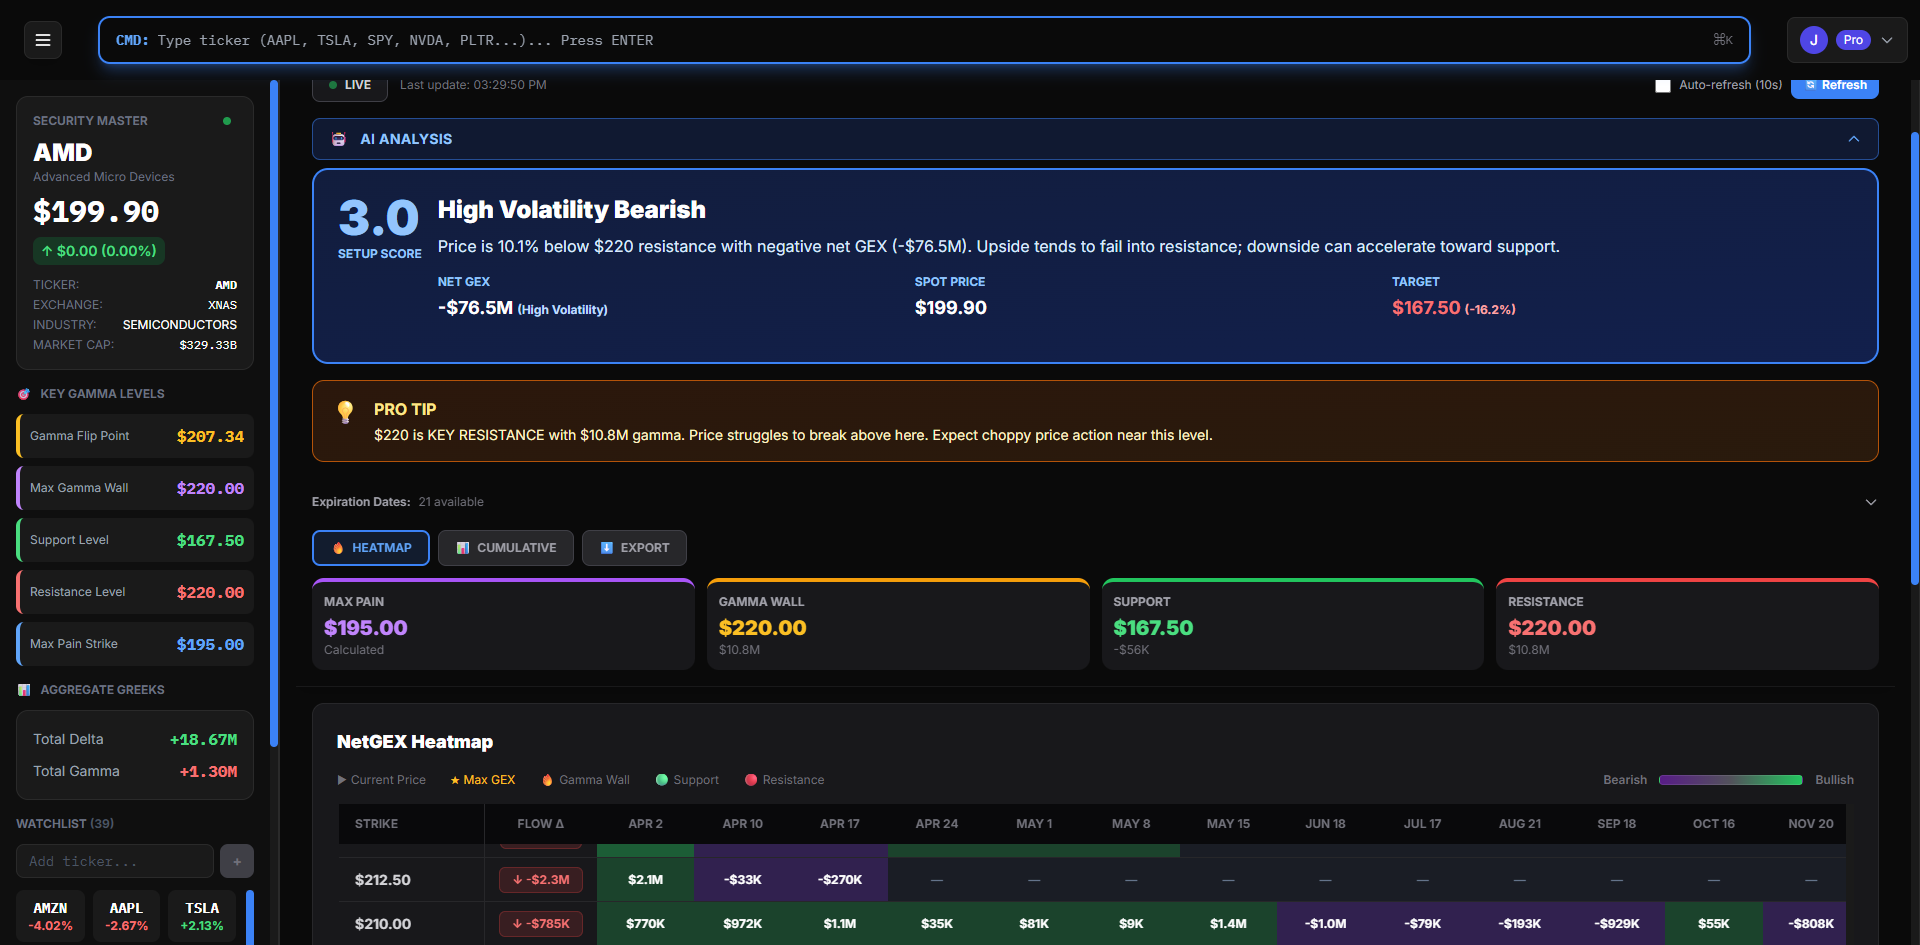
Sweepalgo.com reveals AMD’s specific gamma exposure setup with institutional-grade precision, identifying exactly where mechanical hedging flows will create support, resistance, and volatility amplification zones. The platform’s AI analysis scores this setup as 3.0 “High Volatility Bearish,” indicating price sits significantly below major resistance with heavily negative net GEX that tends to accelerate downside moves toward support levels.
Key AMD Gamma Exposure Metrics

The Sweepalgo.com gamma dashboard displays the critical levels driving AMD’s price action in the semiconductor selloff. Current spot price trades at $199.90 with net gamma exposure of -$76.5M flagged as “High Volatility” by the platform’s algorithms, representing one of the most extreme negative gamma readings in the semiconductor sector currently.
The gamma flip point appears at $207.34, marking where market dynamics fundamentally shift from volatility amplification below to volatility dampening above. This level becomes crucial for traders to monitor because breaking above it would change AMD from a trending, high-volatility stock into a more stable, range-bound name where different strategies become optimal.
The maximum gamma wall sits at $220.00 with $10.8M in concentrated gamma exposure, creating the heaviest resistance in AMD’s entire options chain. This explains why the stock has repeatedly failed to sustain breakouts through $220 despite strong semiconductor demand narratives and positive earnings revisions. The mechanical selling pressure from market maker hedging at this level overwhelms fundamental buying interest.
Support emerges at $167.50 where gamma positioning creates a natural floor, though Sweepalgo.com’s AI analysis targets this exact level with a -16.2% downside projection from current prices. Breaking through $167.50 would trigger accelerated selling from market maker hedging flows, potentially creating the panic scenario that semiconductor investors fear during chip cycle downturns.
The platform’s pro tip highlights the critical nature of the resistance: “$220 is KEY RESISTANCE with $10.8M gamma. Price struggles to break above here. Expect choppy price action near this level.” This isn’t speculation—it’s mathematical reality of how market maker hedging creates mechanical selling pressure that caps rallies regardless of bullish sentiment.
Understanding AMD’s High Volatility Bearish Setup
This extreme bearish gamma exposure profile creates several specific implications for AMD traders navigating the current semiconductor landscape. The $220 resistance isn’t merely a technical chart pattern—it’s backed by $10.8M in gamma that forces market makers to sell shares as price approaches, creating real supply that prevents sustained breakouts even when chip demand appears strong.
Current price at $199.90 sits deep in negative gamma territory where volatility amplification dominates every price tick. Small moves trigger disproportionate hedging responses, explaining why AMD can fall 3% on days when semiconductor ETFs drop only 1%, or rally 5% when peers move 2%. The -$76.5M positioning acts as a volatility multiplier that makes AMD behave more erratically than fundamentals alone would suggest.
The negative gamma setup means market maker hedging works with momentum rather than fighting against it. If AMD rallies toward $207, their hedging requires buying shares, which pushes price higher and triggers more buying. If AMD falls toward $180, their hedging requires selling shares, which accelerates the decline and triggers more selling. This creates the explosive price action that makes AMD both exciting for momentum traders and dangerous for buy-and-hold investors without proper risk management.
Sweepalgo.com’s AI interpretation provides the setup clearly: “Price is 10.1% below $220 resistance with negative net GEX (-$76.5M). Upside tends to fail into resistance; downside can accelerate toward support.” The -16.2% downside target at $167.50 represents where the next meaningful gamma-backed support exists, suggesting significant risk remains if the current level fails to hold.
The $220 Gamma Wall Explained
At the $220 strike, market makers have $10.8M in gamma exposure according to Sweepalgo.com, representing the most concentrated positioning in AMD’s entire options complex across all expirations. This creates what professional traders recognize as a “gamma wall”—a price level where hedging requirements become so substantial that they create natural resistance preventing breakouts through pure mechanical pressure.
The mechanics work as follows: as AMD approaches $220, market makers who are short call options at this strike see their delta exposure grow rapidly due to gamma effects. To maintain their required delta-neutral positioning and manage risk, they must sell AMD shares in size. This selling isn’t based on bearish views or fundamental concerns—it’s pure mathematical hedging creating real supply at this level that overwhelms demand.
AMD has tested this $220 zone multiple times over recent months but failed to achieve sustained closes above it, and the gamma exposure concentration explains the repeated failures better than any fundamental narrative. Each approach to $220 triggers the same mechanical selling pressure, creating consistent rejection patterns that technical analysts interpret as resistance but that actually stem from market maker hedging mathematics.
Breaking through the $220 gamma wall requires either massive buying volume that can absorb the $10.8M in hedging-driven selling, or a reduction in the gamma concentration itself through options expiration and position unwinding. Until one of these conditions materializes, $220 remains a formidable ceiling backed by mechanical forces rather than merely psychological resistance levels.
How AMD’s Negative Gamma Exposure Amplifies Semiconductor Volatility
With -$76.5M net gamma exposure, AMD operates in an environment where market maker hedging amplifies price movements rather than providing the stabilizing influence seen in positive gamma stocks. This extreme negative positioning helps explain why AMD often leads semiconductor selloffs on the downside and rockets higher faster than peers during rallies, creating the explosive two-way volatility that characterizes this stock.
When AMD rises in this negative gamma environment, market makers find themselves with delta positions that have become too short relative to their options book. Rebalancing requires buying AMD shares, and their buying pushes price higher, creating momentum that triggers more hedging-driven buying. This feedback loop explains why AMD can rally 7-10% on days when chip sector news seems only moderately positive—the mechanical amplification from negative gamma multiplies the fundamental move.
Conversely, when AMD falls, market makers become too long delta and must sell shares to rebalance. Their selling accelerates the decline, triggering more hedging-driven selling in a downward spiral. This mechanical amplification explains yesterday’s sharp drop and suggests more volatile moves lie ahead as long as the -$76.5M negative gamma persists. The Sweepalgo.com heatmap visualizes this dynamic across all strikes, with purple negative gamma concentrated around current price levels confirming the high-volatility regime.
Gamma Flip Scenarios
The $207.34 gamma flip point identified by Sweepalgo.com represents where AMD transitions from the current negative gamma amplification environment to a positive gamma stabilization regime. Breaking above and holding this level would fundamentally change market dynamics from trending and explosive to range-bound and choppy, requiring completely different trading approaches.
If AMD manages to break and sustain above $207.34, market maker hedging flips to buying dips and selling rallies, which compresses volatility and creates the mean-reverting behavior where breakout attempts fail. Implied volatility would decline, options premiums would shrink, and the stock would trade more like a stable large-cap than a volatile momentum name. However, even with positive gamma, AMD would still face the $220 wall above requiring additional work to overcome.
Conversely, if AMD breaks below current levels toward the $167.50 support zone, it enters even deeper negative gamma territory where the acceleration of selling from market maker hedging could create panic conditions. Stops would get hit, triggering more selling, which triggers more forced hedging in a cascading decline that feeds on itself. This downside acceleration risk is why Sweepalgo.com’s AI targets $167.50 with a -16.2% projection—that’s where the next meaningful support exists from a gamma exposure perspective.
Trading AMD’s Extreme Negative Gamma Environment
Understanding AMD’s -$76.5M gamma exposure enables strategic trading decisions aligned with market structure rather than fighting against invisible mechanical flows. The extreme negative positioning creates specific opportunities and risks that differ substantially from how you would trade a stable, positive-gamma stock.
Directional Trading Strategies
For traders looking to capture AMD’s amplified volatility, several strategies align well with the current extreme negative gamma exposure setup. Long put options leverage the downside amplification effect, where a 3% decline in AMD shares could translate to a 6-8% decline due to market maker hedging flows accelerating the move. Buying $195 or $190 puts expiring 2-4 weeks out targets the $167.50 support zone identified by Sweepalgo.com, with stops placed above the $207.34 gamma flip point to exit if the setup invalidates.
Bear put spreads offer a defined-risk approach to capture the downside bias while limiting capital at risk. Selling the $185 put while buying the $195 put creates a $10 spread that profits from AMD declining toward support, with maximum gain occurring if AMD trades below $185 at expiration and maximum loss limited to the debit paid. This structure makes sense given the -16.2% downside target from Sweepalgo.com’s AI analysis.
On the bullish side, trading AMD’s negative gamma requires acknowledging the $220 gamma wall as likely capping upside attempts. Bull call spreads buying the $200 call and selling the $210 call target a move toward the gamma flip point at $207.34, accepting limited upside in exchange for defined risk. This prevents the unlimited loss scenarios that can occur when negative gamma amplifies moves beyond expectations and stops get blown through.
Swing traders taking directional stock positions should use the gamma levels rather than arbitrary percentage stops. For long positions, placing stops just below $195 or $190 based on your time frame makes sense, as breaking these levels likely triggers accelerated selling toward $167.50. For short positions, stops above $207.34 protect against the regime change where gamma flips positive and market dynamics fundamentally shift against your bearish thesis.
Position Sizing for Extreme Volatility
Standard position sizing rules completely break down in extreme negative gamma exposure environments like AMD’s current -$76.5M setup. The amplification of moves means volatility can spike to levels that seem impossible based on the stock’s historical behavior, stop losses can get bypassed on overnight gaps, and the mental stress from large swings can force emotional decisions at the worst possible times.
If your normal allocation to a single semiconductor stock is 5% of your portfolio, AMD’s extreme negative gamma warrants reducing to 2% maximum. If you typically risk 2% per options trade, reducing to 0.5-1% per AMD trade protects capital during the volatility explosions that negative gamma creates. This isn’t being overly conservative—it’s recognizing that AMD’s -$76.5M positioning creates a fundamentally different risk profile than stable stocks.
The math supports defensive sizing: if AMD’s normal daily volatility is 2%, negative gamma can amplify that to 4-5% moves. A position sized for 2% daily moves suddenly faces 5% adverse moves, turning a manageable 10% portfolio drawdown into a devastating 25% hit. Cutting position sizes by 50-60% in extreme negative gamma environments keeps these amplified moves manageable rather than catastrophic.
Stop Loss Placement Using Gamma Levels
Sweepalgo.com gamma levels provide the logical framework for stop-loss placement because they represent where market structure breaks down and mechanical flows reverse. For AMD long positions, placing stops just below key support zones makes sense, with $195, $190, or $167.50 serving as logical levels depending on your timeframe and risk tolerance.
The $167.50 level deserves particular attention as the major support identified by both gamma analysis and Sweepalgo.com’s AI targeting. Breaking this level would trigger massive selling from market maker hedging flows as the stock enters even deeper negative gamma territory. Better to exit before that cascade begins rather than hoping for a bounce that may not materialize until much lower prices.
For short positions betting on AMD’s weakness, stops above the $207.34 gamma flip point protect against regime change. If AMD breaks and holds above this level, gamma flips positive and market dynamics fundamentally shift—dips get bought mechanically through hedging flows rather than sold, invalidating your bearish setup. Shorts should exit before fighting against a new stabilizing regime.
Time-based stops also make sense in extreme negative gamma: if AMD hasn’t reached your target within 1-2 weeks, the thesis may be wrong or timing off. Extended holding in extreme volatility environments erodes mental capital even if the position hasn’t hit stops, making fresh evaluation after set time periods worthwhile.
Why Sweepalgo.com for AMD Gamma Exposure Analysis
All gamma exposure data in this AMD analysis comes from Sweepalgo.com—the professional-grade platform that reveals market structure insights unavailable through standard charting packages or free options data. For volatile semiconductor stocks like AMD, this institutional-quality analysis often means the difference between profitable trades and getting stopped out by moves you never saw coming.
Sweepalgo Platform Features for Semiconductor Traders
Sweepalgo.com provides real-time gamma exposure heatmaps that visualize exactly where market maker positioning concentrates across AMD’s entire options chain spanning 21 expiration dates. The color-coded interface uses green for positive gamma zones where prices stabilize and purple for negative gamma zones where volatility amplifies, making it instantly clear whether you’re trading in calm or explosive conditions.
The platform’s AI-powered setup analysis eliminates the guesswork from gamma interpretation, scoring AMD at 3.0 “High Volatility Bearish” and providing specific price targets backed by mechanical hedging analysis rather than subjective technical patterns. The system automatically identifies the $207.34 gamma flip point, $220 gamma wall with $10.8M concentration, and $167.50 support target, delivering institutional-grade analysis in seconds that would take hours to calculate manually.
Critical level identification extends beyond simple resistance and support, incorporating max pain calculations showing where option sellers profit most ($195 for AMD), aggregate Greeks totals revealing overall market maker positioning, and multi-expiration analysis showing how gamma distribution evolves through weekly, monthly, and LEAPS contracts. This complete picture reveals where AMD is likely to find natural equilibrium versus where explosive moves can occur.

Daily Workflow for AMD Traders Using Sweepalgo
Professional semiconductor traders using Sweepalgo.com start each session by checking the platform’s setup score and key gamma levels for AMD and sector peers. This morning routine for AMD means confirming the 3.0 bearish score, noting whether the $207.34 flip point or $220 resistance have shifted, reviewing overnight changes in the gamma heatmap, and comparing AMD’s positioning to other chip stocks for relative strength insights.
Intraday monitoring tracks AMD’s price movement relative to identified gamma levels, watching for approaches to the flip point that could signal regime changes or tests of the gamma wall that typically fail. The platform’s real-time updates reflect new options trades hitting the market, allowing detection of institutional repositioning before it impacts stock price. Alerts set at $207.34, $220, and $167.50 ensure you catch critical developments even when focused on other positions.
Position management becomes scientific rather than emotional when guided by gamma data. Instead of arbitrary profit targets, use gamma walls like $220 for long exits or gamma flip points like $207.34 for trailing stops on shorts. Stop placement at gamma-backed support like $167.50 aligns with where market structure actually breaks rather than arbitrary percentage levels that might be too tight or too loose for current conditions.
The Edge Sweepalgo Provides Over Manual Analysis
Without Sweepalgo.com, calculating gamma exposure manually requires downloading AMD’s complete options chain data, applying Black-Scholes or similar pricing models to every strike, multiplying by open interest to get aggregate exposure, summing across 21 different expiration dates, identifying key inflection points, and updating continuously as the market trades. This process consumes 2-3 hours minimum for a single stock and requires advanced mathematical knowledge.
The platform completes these calculations instantly with professional accuracy, providing the same analysis that hedge funds pay quantitative analysts six-figure salaries to generate. The time savings allow semiconductor traders to analyze AMD, NVDA, INTC, and other chips quickly, comparing relative gamma exposure setups to identify the best risk/reward opportunities rather than spending all day calculating one stock’s positioning.
The edge gained extends beyond time efficiency to insight quality. Sweepalgo.com’s AI identifies patterns across thousands of stocks, learning which gamma configurations precede explosive moves versus false breakouts. This pattern recognition provides setup scores and probability-weighted targets that incorporate historical behavior, not just current mathematical relationships, giving semiconductor traders conviction in their directional bias.
Visit Sweepalgo.com to access free trial periods with real-time data, AMD gamma tracking matching this analysis exactly, educational resources teaching gamma concepts from basics to advanced applications, and community Discord where semiconductor traders share setups and market structure insights. Subscription tiers from Basic through Institutional ensure both retail traders and professional firms access the tools matching their needs and trading capital.
AMD Technical Analysis Beyond Gamma
While gamma exposure provides crucial insights into AMD’s mechanical market structure, combining it with traditional technical analysis and semiconductor sector context creates the complete picture needed for high-probability trades. AMD’s chart patterns, momentum indicators, and relative strength versus peers all add important context to the gamma setup.
AMD weekly charts show breakdown from the consolidation pattern that characterized early year trading, with recent price action forming a potential bear flag that could resolve lower toward major support zones. Volume patterns show distribution rather than accumulation, with selling pressure increasing on down days relative to buying pressure on up days—a concerning development for bulls hoping for reversal.
The $220 level that appears as a gamma wall also corresponds to prior support from late last year that has flipped to resistance, creating confluence between technical and mechanical barriers. Similarly, the $167.50 support identified by gamma exposure analysis aligns with the 200-day moving average and a Fibonacci retracement level from AMD’s 2024 rally, providing multiple reasons to expect buyers to emerge at this level if tested.
Momentum indicators like RSI likely sit in bearish territory between 30-45, showing selling pressure without yet reaching the extreme oversold levels below 30 that typically precede bounces. This suggests AMD has room to fall further before hitting capitulation, aligning with Sweepalgo.com’s -16.2% downside target. MACD bearish crossovers would confirm the negative momentum, matching the High Volatility Bearish gamma setup score.
Relative strength versus the semiconductor sector provides additional context. If AMD’s -$76.5M gamma exposure is more negative than sector peers, it suggests AMD-specific options positioning rather than sector-wide dynamics, potentially indicating informed traders positioning for company-specific risks. Comparing gamma setups across NVDA, INTC, MU, and other chips using Sweepalgo.com reveals whether AMD’s extreme negative gamma is unique or part of broader sector positioning.
Risk Management for AMD’s Extreme Volatility
AMD’s -$76.5M negative gamma exposure requires the most stringent risk management discipline because this extreme positioning creates volatility that can overwhelm even well-planned trades. Position sizing, stop placement, and hedging strategies all need significant adjustment from what you might use for stable, positive-gamma stocks.
Maximum position sizes should be 1-2% of portfolio for AMD stock positions and 0.5% maximum risk per trade for AMD options, substantially lower than the 3-5% stock and 1-2% options allocations appropriate for normal volatility names. This defensive sizing accounts for the 2-3x volatility amplification that -$76.5M negative gamma creates versus what AMD’s historical volatility might suggest.
Stop losses placed at gamma-identified structural levels make far more sense than arbitrary percentage stops that don’t account for where market mechanics change. For AMD longs, $167.50 represents the critical gamma-backed support where market structure breaks down if violated, making it the logical stop level despite being 16% below current price. Tighter stops at $195 or $190 work for shorter timeframes but accept higher probability of getting stopped out by normal volatility.
For shorts, stops above the $207.34 gamma flip point exit before market dynamics fundamentally change from amplification to stabilization. Allowing shorts to run through a gamma flip means fighting against mechanical buying on dips rather than selling into them, turning a good trade setup into a bad one. Better to exit and reevaluate once price breaks above and gamma flips positive.
Hedging strategies for long stock holders facing AMD’s extreme negative gamma include buying protective puts at $190 or $185 strikes to cap downside risk at defined levels. These put options will be expensive due to elevated implied volatility from the negative gamma environment, but the insurance they provide justifies the cost when holding a stock that can gap down 5-7% overnight. Collar strategies combining put buying with call selling at $210 or $215 finance the hedge while accepting limited upside—a reasonable trade-off in extreme volatility.
Key Takeaways: AMD Gamma Exposure Analysis
AMD’s gamma exposure of -$76.5M represents an extreme negative positioning that places the stock in the highest volatility category among liquid semiconductor names. This isn’t just a bearish indicator—it’s a structural reality that will amplify moves in both directions until options positioning shifts or price moves enough to change the gamma landscape substantially.
The stock at $199.90 sits deep in negative gamma territory where mechanical amplification dominates price action, explaining yesterday’s sharp decline and suggesting more explosive moves ahead. The -$76.5M positioning means 2-3% fundamental moves can become 5-7% actual moves when market maker hedging kicks in, creating the two-way volatility that makes AMD exciting for traders but treacherous for investors.
The $220 gamma wall with $10.8M concentration represents formidable mechanical resistance that has repeatedly capped rallies regardless of positive semiconductor narratives. This level won’t yield to fundamental optimism alone—it requires either massive volume to overwhelm the hedging flows or reduction in gamma concentration through options expiration before sustained breakouts become possible.
The $207.34 gamma flip point marks where market dynamics fundamentally shift from amplification below to stabilization above. Traders must adjust strategies completely based on which side of this line AMD trades, using directional momentum approaches below and mean-reversion strategies above. Failing to recognize this regime change is a common mistake that turns winning trades into losers.
Sweepalgo.com provides the institutional-grade analysis needed to trade AMD’s extreme gamma setup effectively, automatically identifying key levels, scoring directional bias, tracking real-time positioning changes, and delivering insights that would require hours of manual calculation. Understanding these mechanical forces gives semiconductor traders an edge over those relying solely on chip demand forecasts or technical chart patterns.
Action steps include signing up for Sweepalgo.com to access AMD’s real-time gamma analysis, monitoring daily as semiconductor sector dynamics evolve, setting alerts at $207.34, $220, and $167.50 to catch regime changes, reducing position sizes 50%+ versus normal allocations given extreme volatility, and using gamma levels for all entry, exit, and stop decisions rather than arbitrary percentages.
AMD’s negative gamma exposure creates both substantial risk and significant opportunity for prepared traders. The -$76.5M positioning means moves will be larger and faster than fundamentals alone suggest, making the stock dangerous for the unprepared but profitable for those who understand the mechanical amplification at work. Ignore gamma at your peril in semiconductor stocks—embrace it for edge.
Ready to trade AMD with gamma exposure insights? Visit Sweepalgo.com to access real-time AMD and semiconductor sector gamma analysis, track positioning changes across your entire portfolio, get AI-powered setup scores with probability-weighted targets, join a community of options traders using structural data for edge, and start your free trial with no credit card required.
sweepAlgo: We provide institutional-quality analysis combining gamma exposure data from Sweepalgo.com with semiconductor sector research and technical analysis. Our mission is empowering traders with professional-grade tools to understand market structure and make informed decisions in volatile tech sectors.
Investment Disclaimer: This article is for educational purposes only and does not constitute investment advice. Options trading and stock investing involve substantial risk of loss. Gamma exposure analysis is one tool among many and should not be the sole basis for trading decisions. AMD is a volatile semiconductor stock with significant risks including chip cycle exposure, competitive threats, and macro sensitivity. Consult with a qualified financial advisor before making investment decisions.
Data Source: All gamma exposure data, heatmaps, AI analysis, and setup scores provided by Sweepalgo.com – Professional Options Analytics Platform.